Map the world.
Measure what matters.
A workspace where vector tiles, symbology, and quantitative summaries live together—so spatial patterns read like a chart and every layer tells a story backed by numbers.
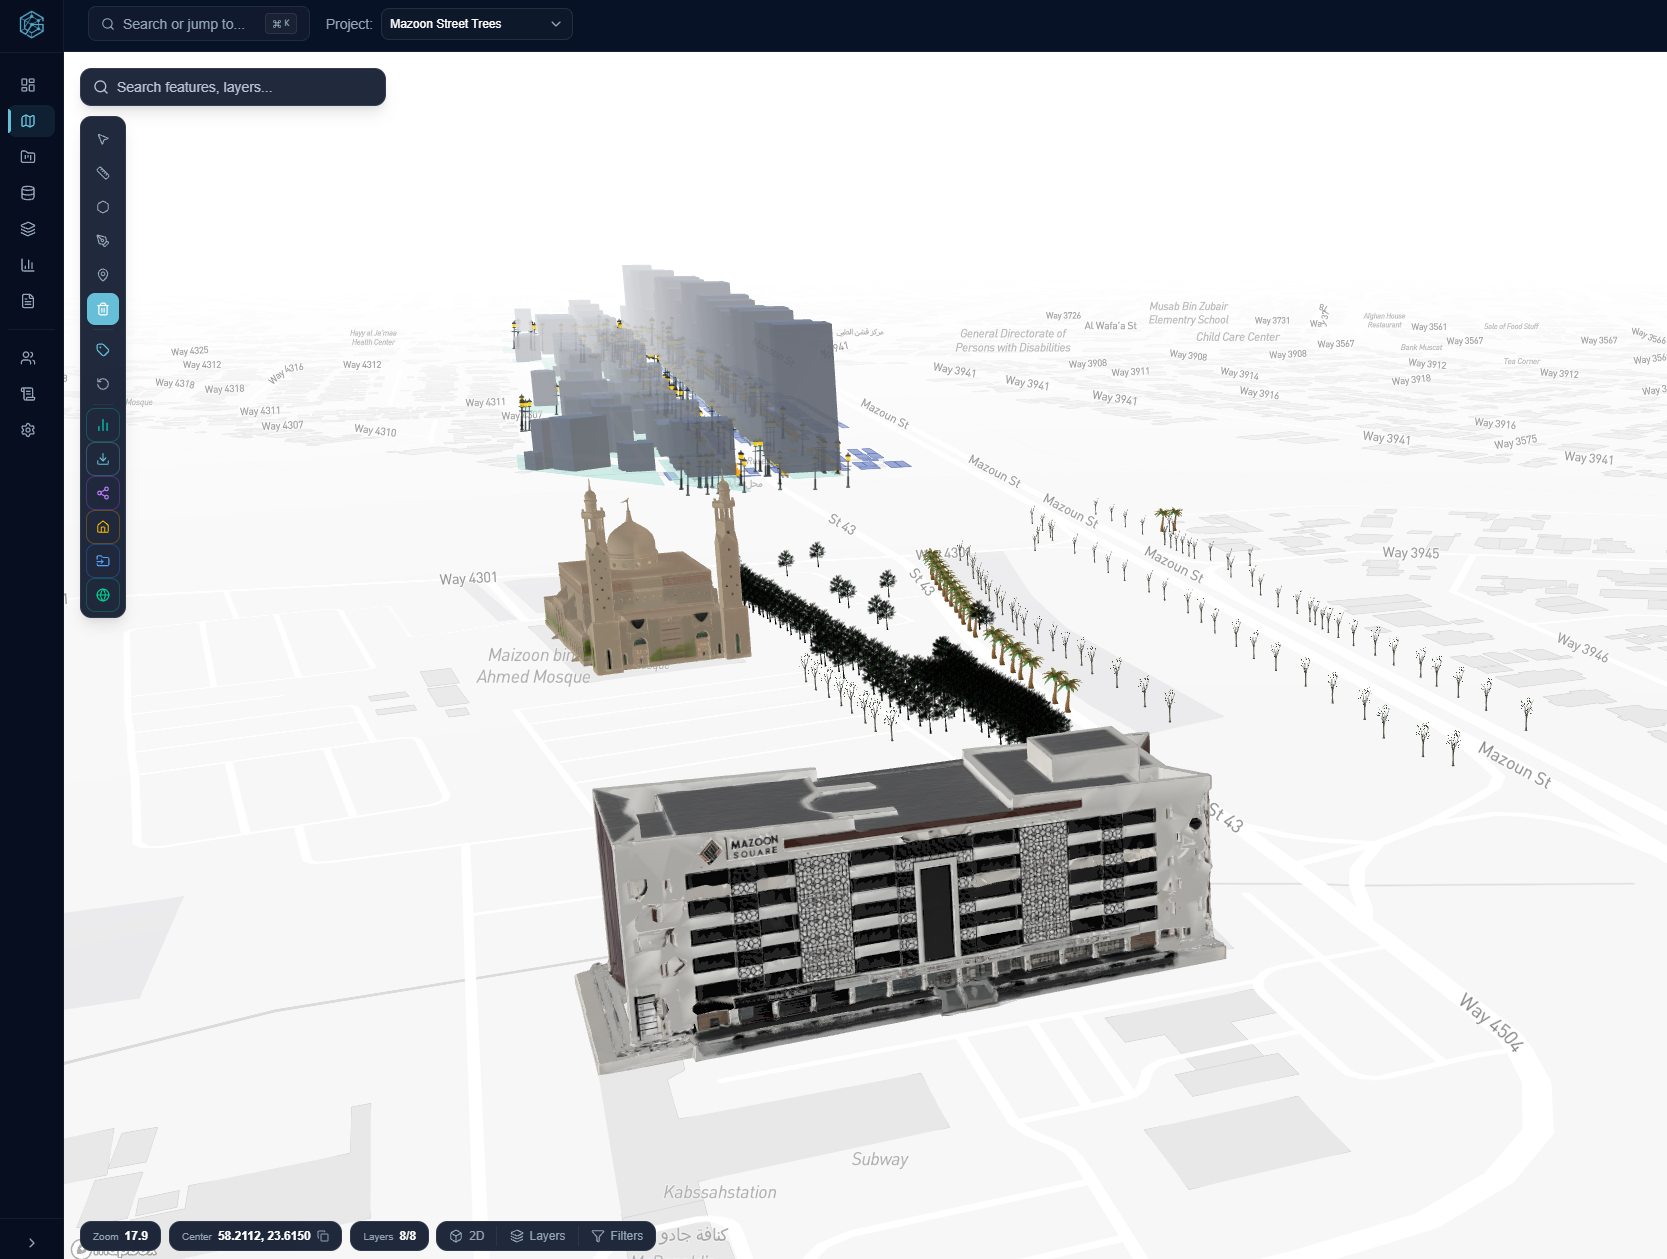
Layers, CRS, and map algebra in one canvas.
Distributions and summaries tied to geography.
From basemap to breakdown—in the same flow.
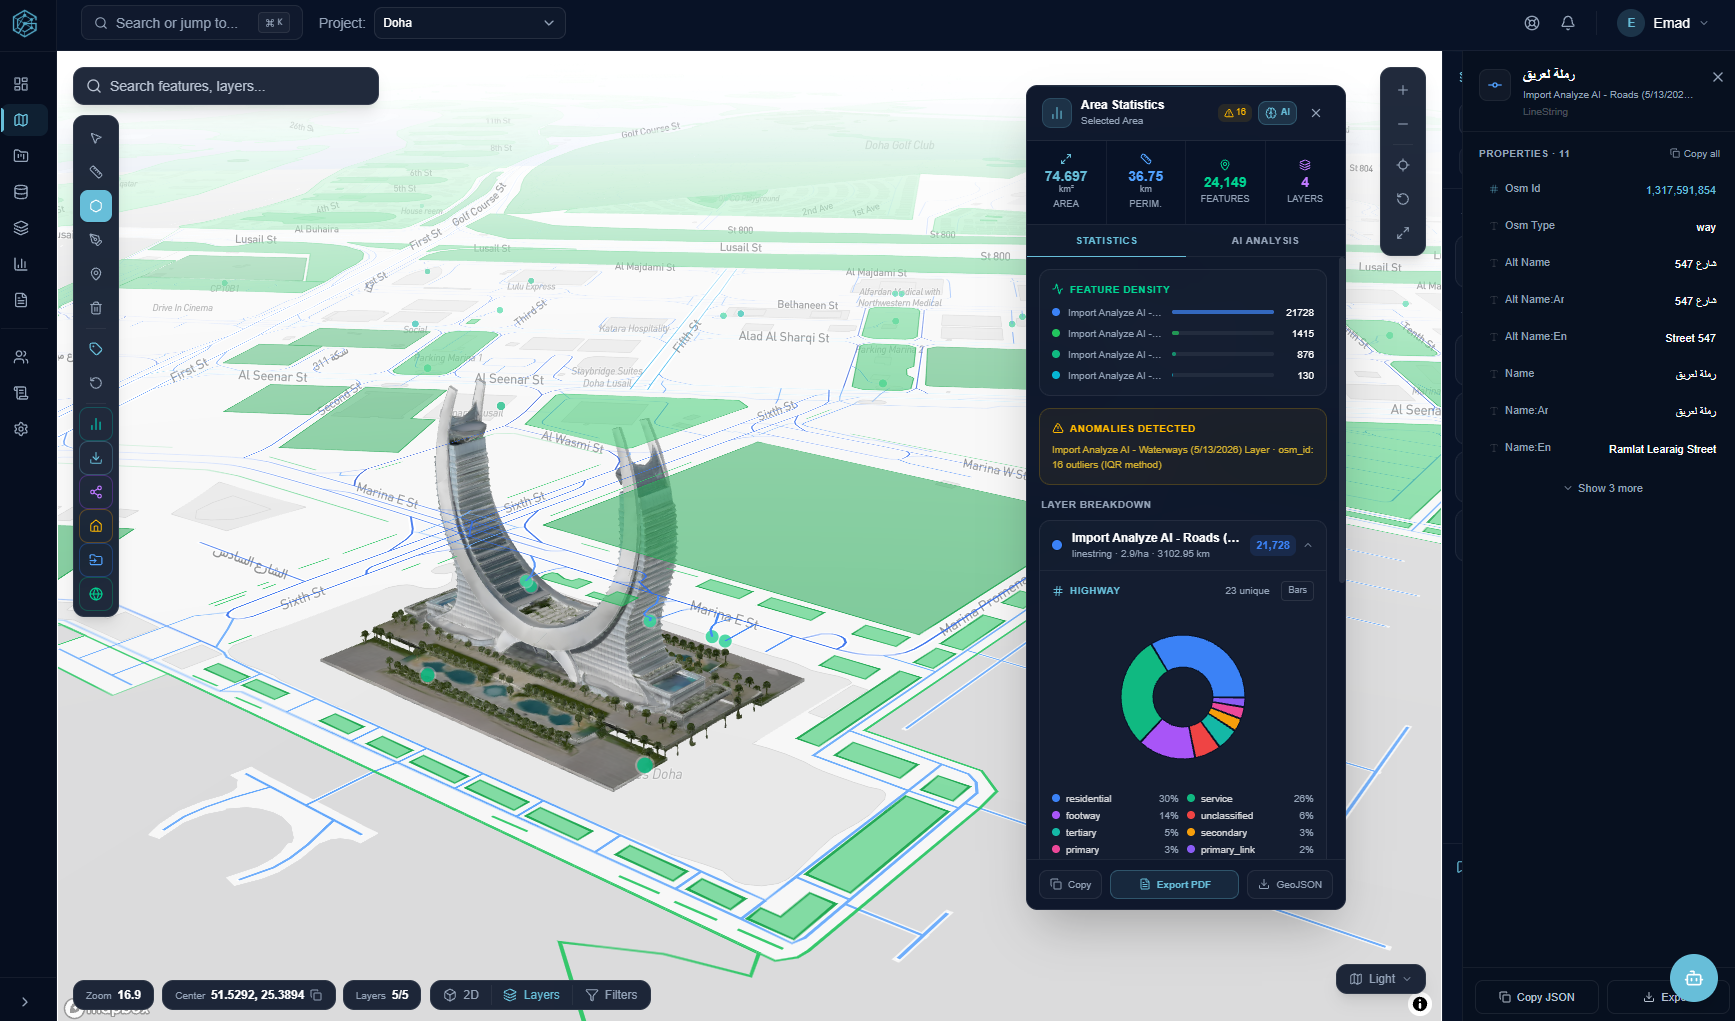
Pan, filter, and style layers; then snap quantitative readouts to the map so analysts see both geometry and distribution at once.
Statistical overlays
Turn regions into measurable units: counts, rates, and ranked segments rendered where they belong—on the map.
Geometry is the index. Statistics are the signal.
Treat every polygon and line as a row in a spatial frame: aggregate, compare cohorts, and stress-test scenarios without leaving the map context.
- Consistent visual grammar between cartography and charts
- Selection-aware summaries that update as you draw or filter
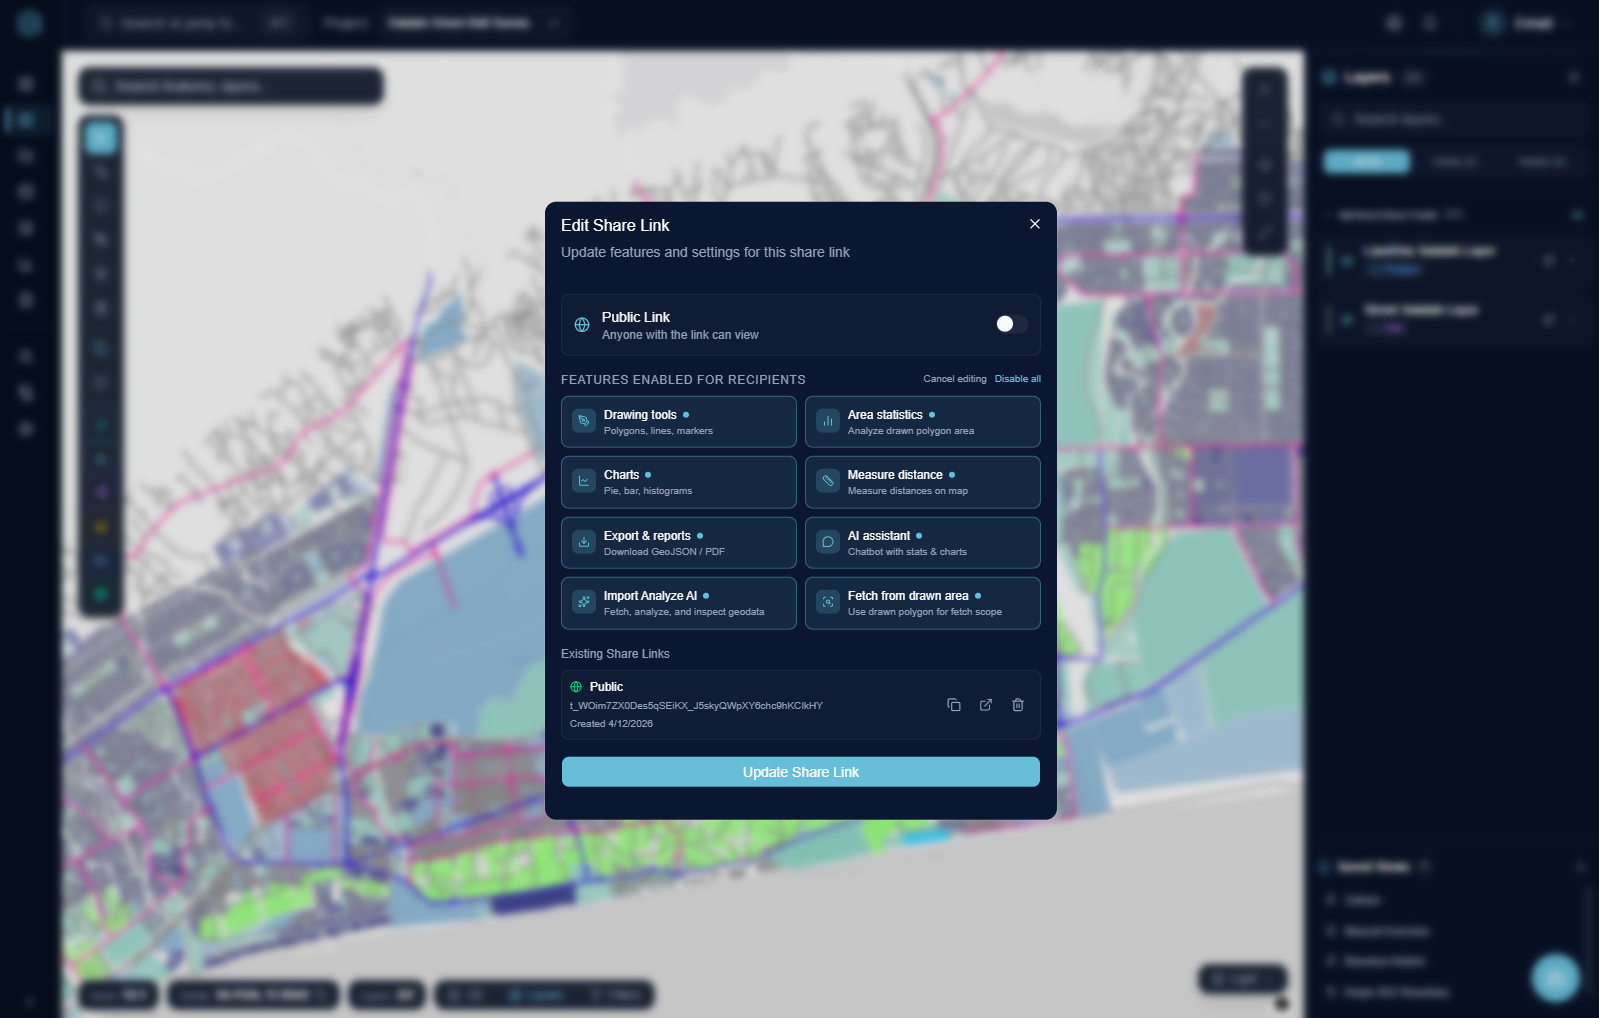
- Export-friendly views for reporting pipelines
Designed for spatial analysts
No partner wall—just capabilities you expect from a serious GIS + analytics stack.
Topology-safe edits
Keep boundaries clean while iterating on parcels and corridors.
Symbology lab
Color ramps, size fields, and opacity driven by attributes.
Geostat hooks
Interpolation and density cues that respect map scale.
Shareable views
Publish read-only snapshots for stakeholders—map state intact.